
Opening
A European tanker fleet operator with 14 vessels trading on crude and product tanker routes managed vessel procurement through a decentralised model: each vessel had a dedicated superintendent who maintained their own chandler relationships, sent their own RFQs, and managed their own ordering, entirely through their personal email inboxes and knowledge of local suppliers.
This model worked operationally. Vessels were provisioned. Port calls ran. The superintendents were experienced professionals who knew their regular ports and their regular chandlers. From an operational standpoint, the procurement function appeared to be working.
From a procurement management standpoint, it was invisible. The procurement director had no view of what the fleet was spending on chandling, with which suppliers, at what prices. Annual chandling spend ran to approximately £2.4 million. The data required to manage that spend was scattered across 14 inboxes and 14 sets of personal spreadsheets.
Why It Matters
Procurement management requires data. Decisions about supplier selection, pricing standards, category benchmarks, and portfolio performance require a dataset that allows comparison, across suppliers at the same port, across ports for the same category, across time for the same supplier. Without this dataset, procurement decisions default to relationship and habit.
The £2.4 million in annual chandling spend was being managed by relationship and habit. The procurement director knew this was not ideal. The problem was the cost of fixing it under the existing model: consolidating procurement data from 14 superintendents' inboxes into a coherent dataset would have required a significant manual extraction effort and produced a historical record that was immediately stale. There was no sustainable path to data-driven procurement management through the existing workflow.
The Challenge
No shared procurement record. Each superintendent's procurement history existed only in their personal inbox. When a superintendent left the company or moved to a different vessel, their procurement knowledge, which chandlers they trusted, what prices were competitive at which ports, which suppliers had quality issues, left with them. The company had no institutional memory of its own procurement.
No systematic quote comparison. When a port call RFQ was sent to three chandlers and three quotes returned by email, comparison required the superintendent to open each email, extract the line item pricing, and build a comparison table in a personal spreadsheet. The quality of this comparison varied by superintendent, some were meticulous, some compared only total price. There was no standardised method or shared record of the comparison rationale.
No visibility for fleet management. The procurement director's view of fleet chandling spend was a quarterly aggregate figure from the accounting system. What was being bought, from whom, at what prices, with what performance outcomes, all invisible.
The Solution
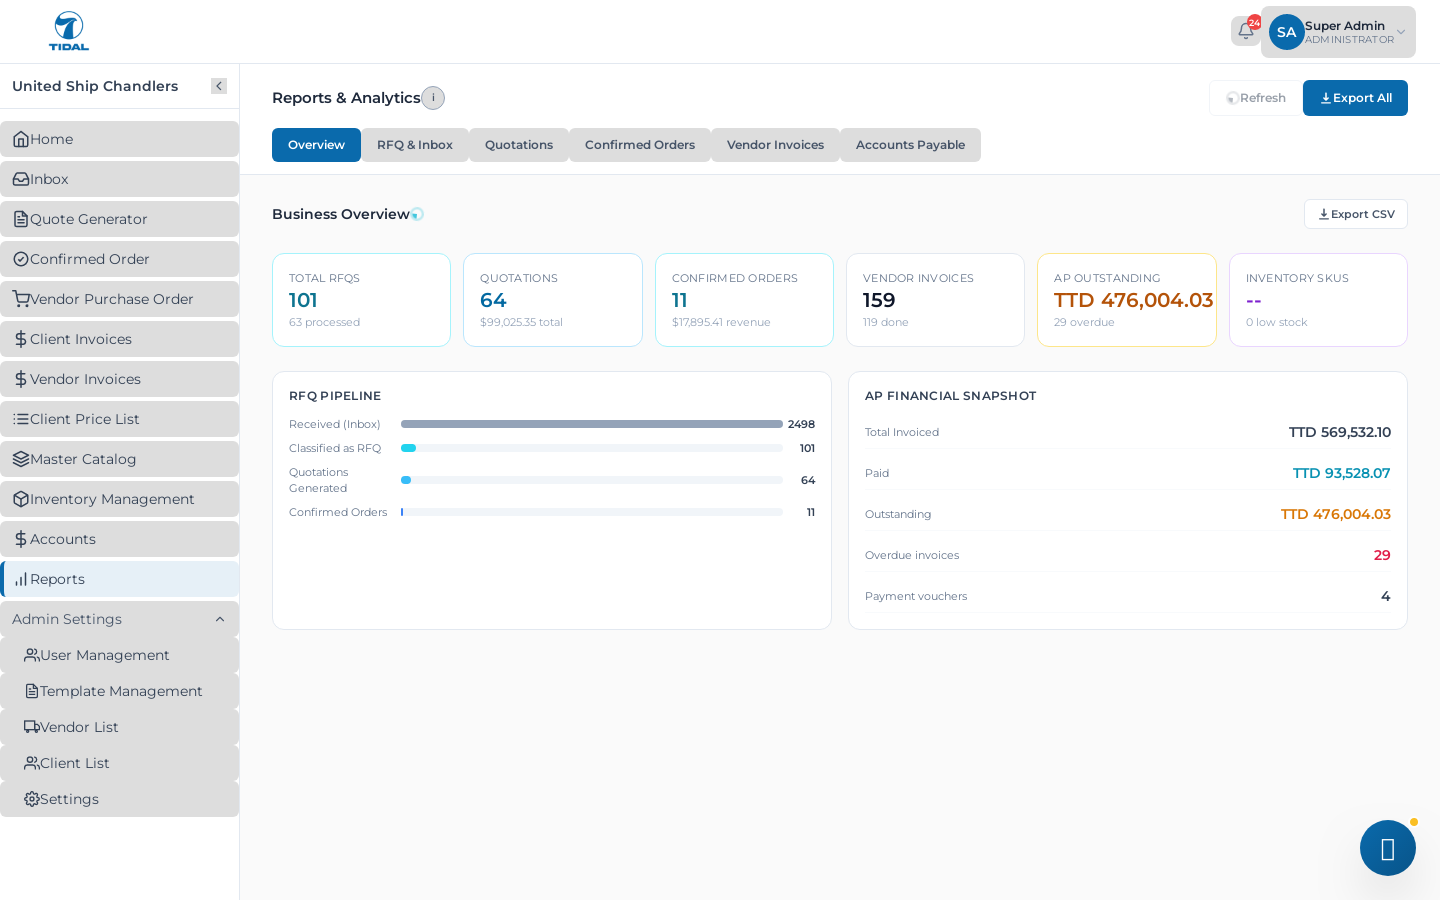
Tidal provided a single procurement workspace for the entire fleet. Each vessel's superintendents issued RFQs through the platform; approved chandlers received and responded through it; quote comparison, order confirmation, and delivery recording all happened in the same system.
Superintendents retained ownership of their vessel's procurement decisions, they continued to select suppliers, approve substitutions, and manage their chandler relationships. What changed was where those decisions were made and recorded. Every RFQ, every quote, every order, and every delivery record now existed in a shared, searchable, auditable system that the procurement director could access in real time.
The quote comparison workflow changed specifically: incoming quotes populated a standardised comparison table automatically. Same line items, same units, side by side across all responding chandlers. Substituted items were highlighted. Missing items were flagged. The comparison that previously took 3-4 hours of manual spreadsheet work took 20-25 minutes of review.
Results
Results measured over six months:
| Metric | Before Tidal | After 6 Months |
|---|---|---|
| Quote comparison time per port call | 3-4 hours | 20-22 minutes |
| Procurement data visible to fleet management | None (aggregate accounting only) | Real-time, full detail |
| Chandler performance records | Personal superintendent knowledge | Structured, shared, quantified |
| Disputed deliveries per quarter | ~8-12 | ~2-3 |
| Benchmarking data available | None | Complete, 6 months |
| Identified pricing improvement opportunity | Not previously calculable | £180K annually |
What the Benchmarking Data Showed
Six months of structured procurement data across 14 vessels produced the fleet's first systematic benchmarking analysis. Key findings:
Significant pricing variation at the same ports. Chandlers at the same major port quotes varied by 12-28% on comparable provisions orders. Some of this variation was legitimate (quality, service level, delivery speed). Some was systematic overpayment to preferred suppliers who had not faced competitive pressure for years.
Category-level inefficiencies. Safety equipment and technical stores, categories where SOLAS compliance requirements give chandlers less price sensitivity, showed the widest pricing variation. Provisions and deck stores, where superintendents compared quotes more carefully, showed tighter pricing.
Substitution patterns. Specific chandlers at specific ports showed substitution rates above 20%, a pattern that was invisible before Tidal because substitution records existed only in individual email threads. High substitution rates indicate either stock management problems or deliberate low-ball quoting on unavailable items.
Supplier concentration risk. Three ports in the fleet's regular rotation used single-supplier relationships for all orders, no competitive quoting at all. These relationships pre-dated the current procurement team and had been maintained by inertia.
The £180K identified in addressable pricing improvement came primarily from two sources: applying competitive quoting standards to the three single-supplier relationships (estimated £95K) and systematically selecting the most competitively priced compliant quote at ports where significant variation existed (estimated £85K). Neither intervention required changing chandlers, it required applying competitive selection criteria consistently.
Key Takeaways
- Decentralised multi-vessel procurement through individual superintendent inboxes is operationally functional but management-invisible.
- Moving to a shared platform preserved superintendent autonomy while giving fleet management the data visibility to make informed portfolio decisions.
- Six months of structured data enabled the first meaningful benchmarking analysis the fleet had ever produced, identifying £180K in addressable pricing improvement.
- Quote comparison time fell from 3-4 hours to 20-22 minutes per port call, recoverable superintendent time across 300+ annual port calls is significant.
- Substitution and supplier concentration patterns are invisible in email-based procurement and visible immediately in a structured platform record.
FAQ
Q1. How did superintendents respond to the change in workflow?
The primary concern among superintendents was losing autonomy over their supplier relationships. Tidal addressed this by maintaining superintendent decision rights, they continued to select suppliers and approve orders. What changed was the recording system, not the decision authority. Once the comparison table improvement was demonstrated, resistance largely disappeared.
Q2. Were all 14 vessels onboarded simultaneously?
No. Onboarding ran in two phases: the four vessels whose superintendents expressed interest first (a three-week process per vessel) and then the remaining ten over the following two months. Phased onboarding allowed early adopters to demonstrate the workflow improvement to colleagues.
Q3. How were chandlers onboarded to the platform?
Chandlers received invitations to the fleet operator's Tidal workspace and could respond to RFQs through the platform interface. Established chandlers who preferred to continue using email were accommodated, their email responses were ingested into Tidal and converted to platform quotes, maintaining the structured comparison capability without requiring chandler behaviour change.
Tidal gives fleet management the procurement visibility it's been missing. Request a fleet operator demo. Request Demo →